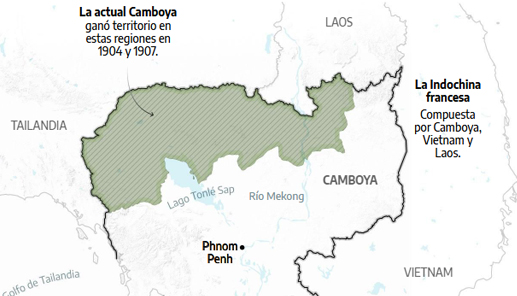
La expansión de la Indochina francesa
The expansion of French Indochina in the 1900s led to a larger modern Cambodia. Cartography created with Illustrator and Google Earth Engine to generate the relief.
Data visualization designer and visual storyteller working at the intersection of journalism, research and digital experiences
My work is about turning complex information into narratives people can read, explore and understand. I create charts, diagrams, maps and visual systems that balance analytical rigor with clarity and editorial intention.
Alongside my professional practice, I teach at university level and develop projects that connect communication, design and critical thinking. I usually collaborate with journalists, developers, researchers and institutions, taking ideas from early concepts to finished publications.
My background allows me to move comfortably between reporting logic, data structures and visual language, building bridges between content and audience.
I’m especially interested in public-interest stories, new storytelling formats and experimentation with how visual culture shapes understanding.
My workflow combines data analysis, design and prototyping across the Adobe ecosystem and interactive tools, always choosing methods according to the problem rather than the other way around.
Currently I work at ElDiario, contributing to visual and data-driven stories within a collaborative newsroom environment.
Here you’ll find a selection of works developed in collaboration with talented teams and partners.
Welcome to this expanding space. I appreciate your interest and please do not hesitate to contact me if you need me! 👋
Ignacio
The expansion of French Indochina in the 1900s led to a larger modern Cambodia. Cartography created with Illustrator and Google Earth Engine to generate the relief.
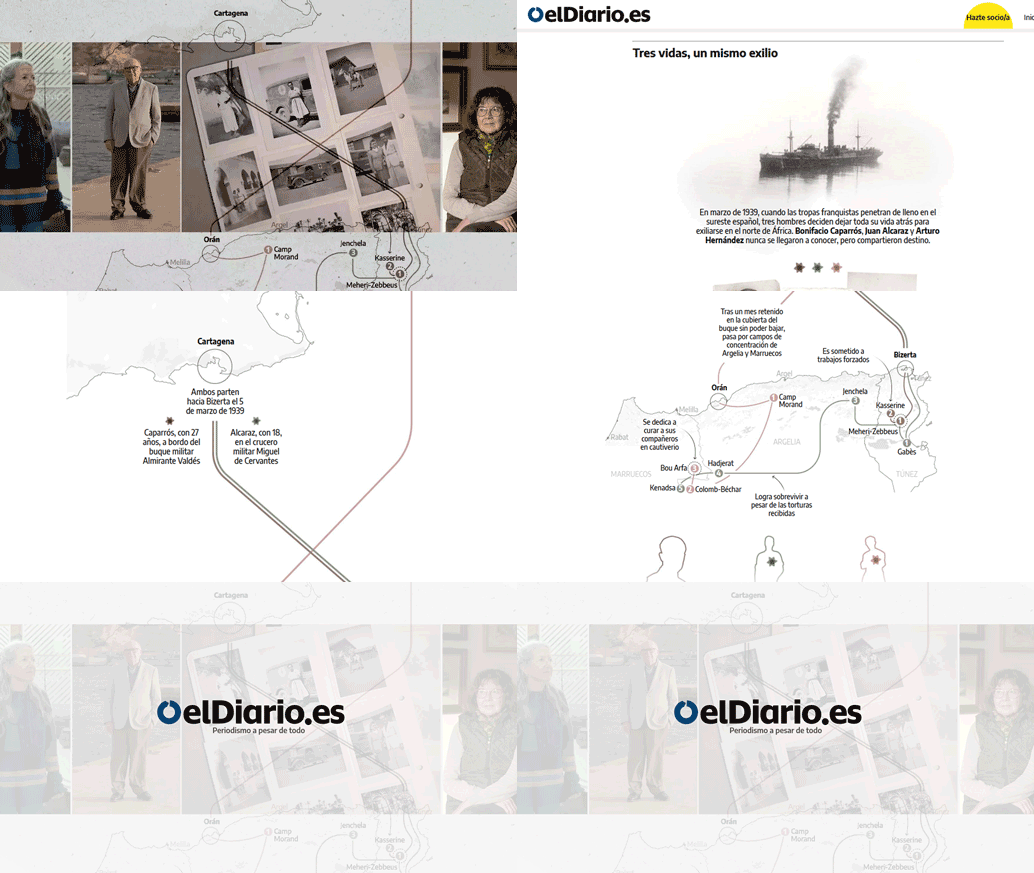
Georeferenced timeline on the exile of three destinations to be read using the scroll function on the Diario.es platform.

In 2025, I began collaborating with the Spanish soccer culture magazine Líbero. There, I started developing visual analyses on different topics. The first was David Beckham's 50th birthday.

Concept and production of the ‘De Goal’ section for the Dutch football culture magazine. Vector illustration and layout with InDesign for print edition.
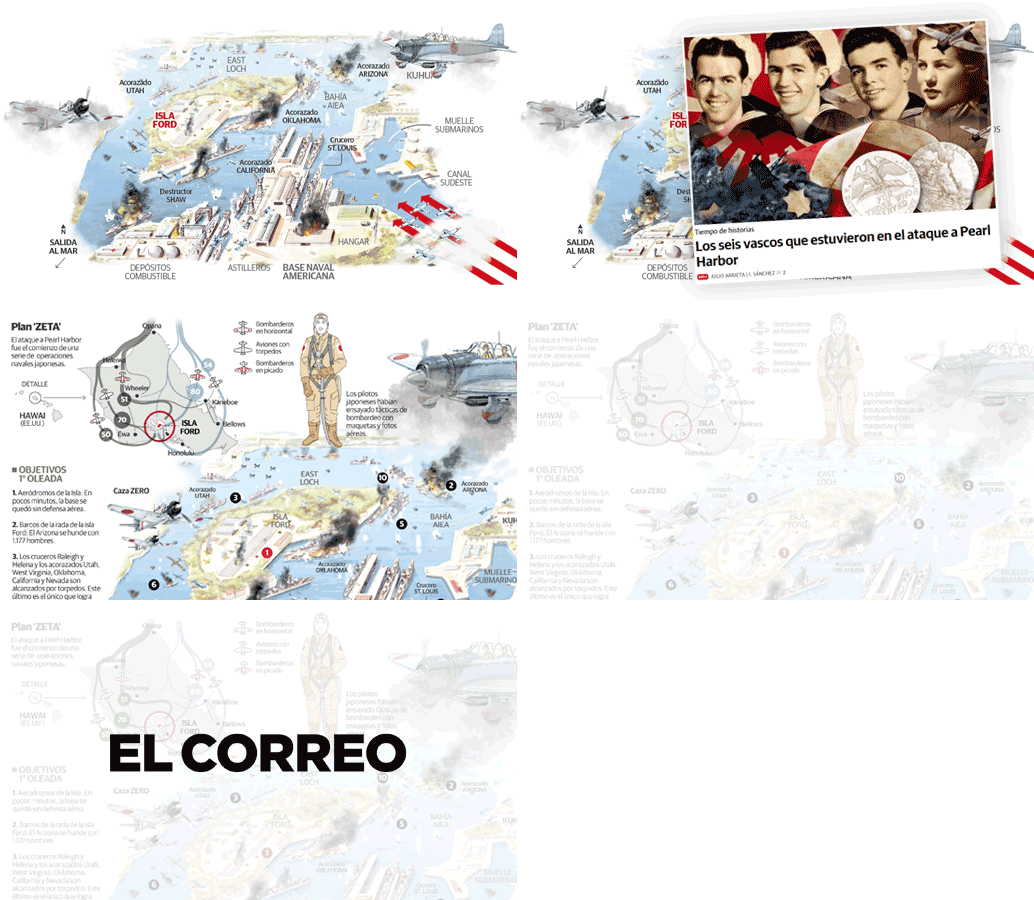
In this update of the printed graphic created by the brilliant Fernando Baptista, I made some adjustments for the web version of this true classic.
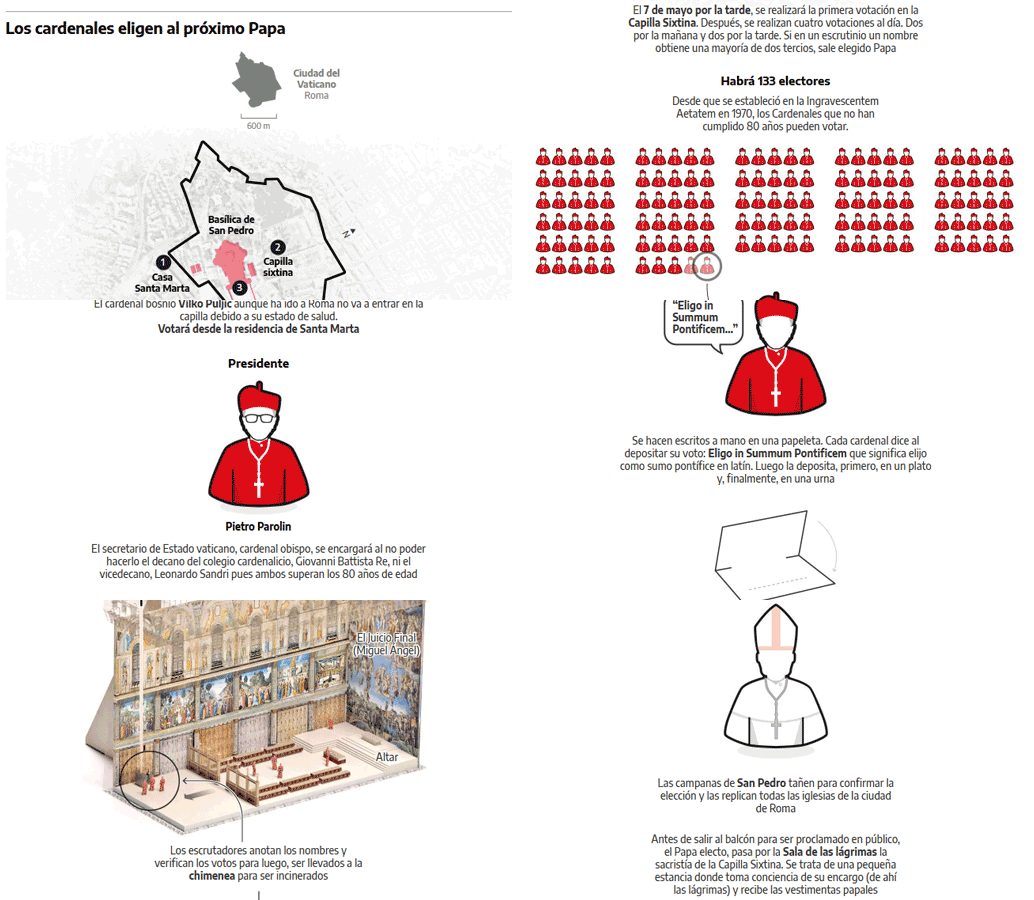
An overview of the election of the new Pope. The ritual can be viewed by scrolling through the images. For this project, I used Illustrator, Strata 3D for modelling, and Google Earth for the satellite image.
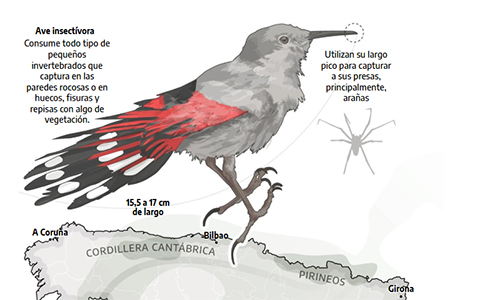
Illustration and cartography to tell this unique story about how this bird lives.
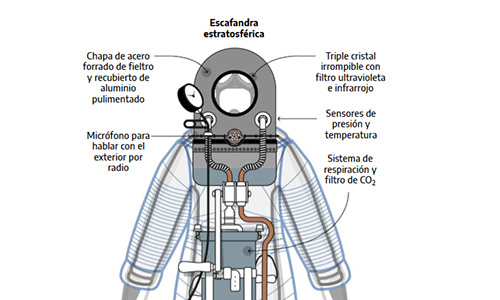
This infographic shows the suit that, in 1936, the Spanish military officer and aeronaut planned to wear to ascend in a balloon to an altitude of 25,000 metres. Discover the first “astronaut” suit in history!
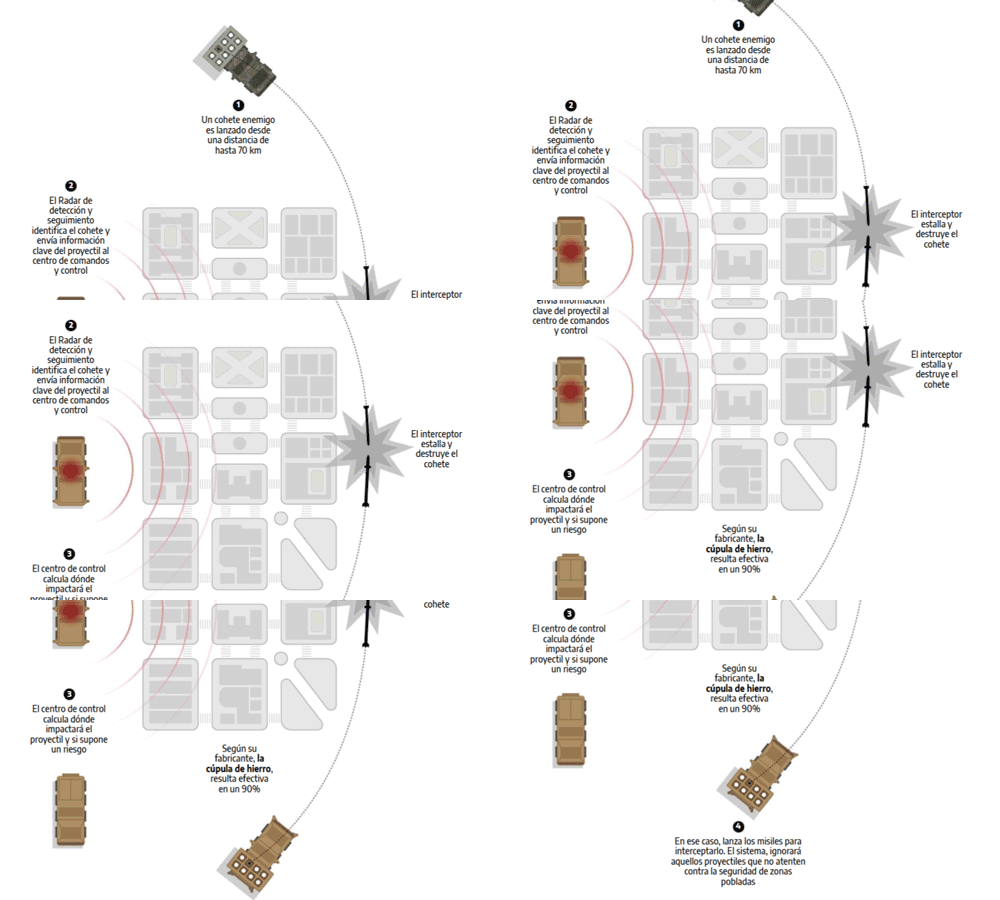
Israel was once again on alert for an almost certain retaliation by Iran for the assassination of the Hamas political leader, and all eyes were once again on its air defence systems. This graphic shows how it works.
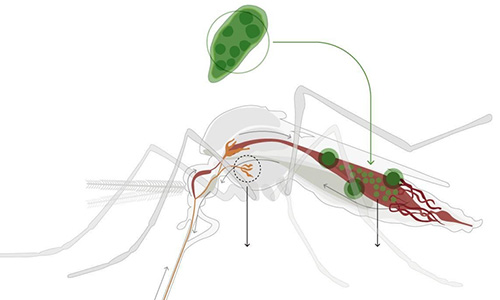
Special feature including several articles explaining the World Mosquito Programme strategy, which aims to eradicate diseases transmitted by the Aedes aegypti mosquito.
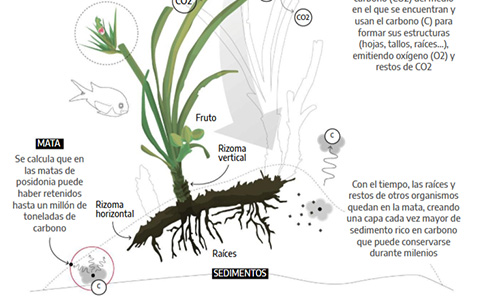
Why protect them? Their destruction could result in the massive release into the atmosphere of up to 1 billion tonnes of carbon accumulated over centuries. This infographic explains why.
The story behind the couple of doctors who created the Urihi healthcare model that saved the Yanomami in the 1990s and 2000s — and were punished for it. I've produced maps, charts and illustrations for this special Sumaúma feature.
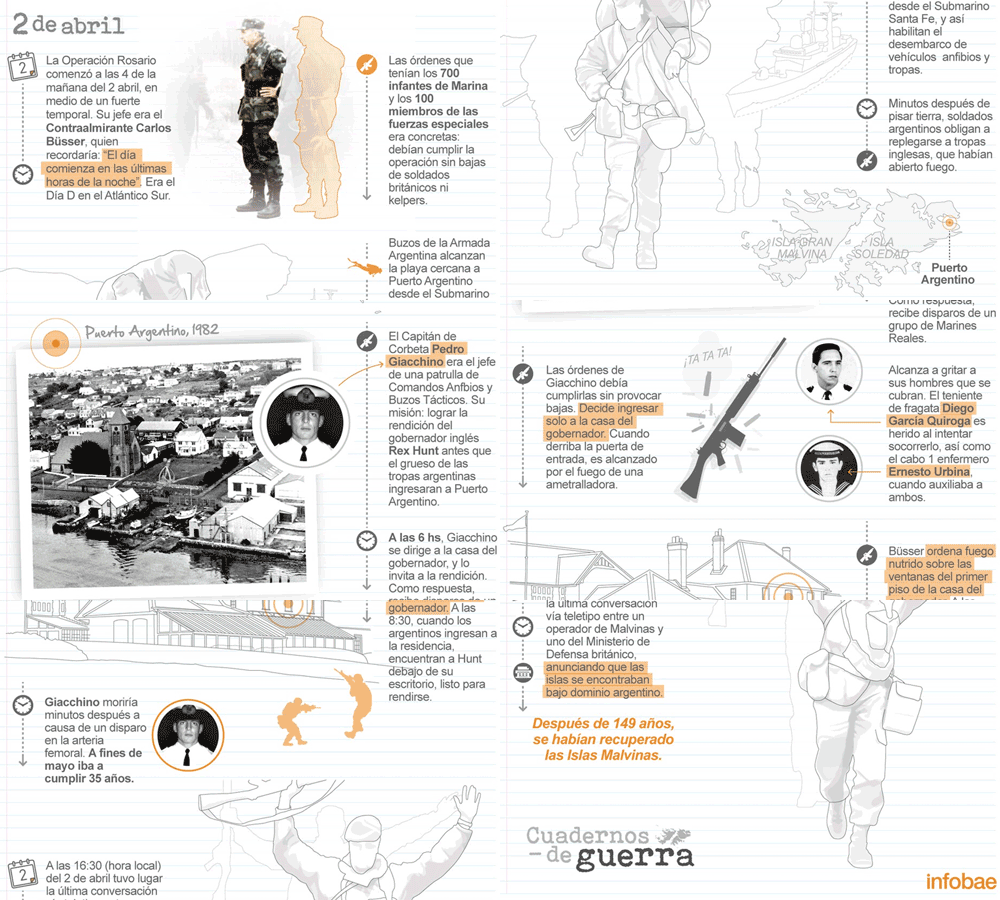
The commanders had decided to recover the islands, raise the national flag, leave only one combat unit behind, and negotiate with Great Britain. The operation was called Rosario. Check out this scroll I made for Infobae showing the days leading up to the event!
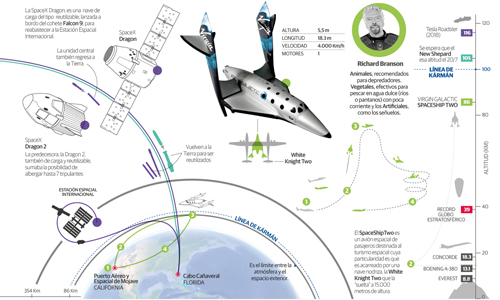
This article for the print edition of El Correo shows how Richard Branson, Elon Musk and Jeff Bezos want to do business with suborbital tourism.
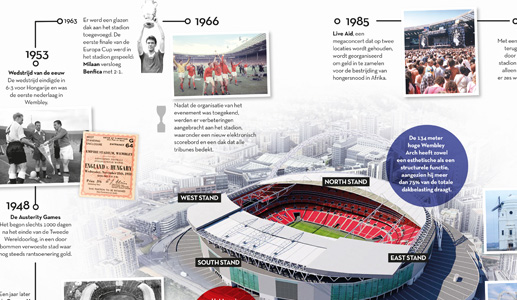
Concept and production of the ‘De Stadion’ section for the Dutch magazine on football culture. Vector illustration, 3D modelling with Strata3D and layout with InDesign for the print edition.
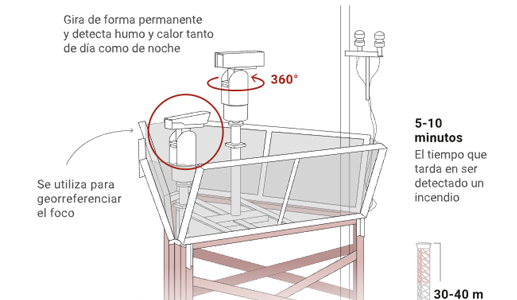
Maps and infographics for La Nación newspaper showing the ordeal experienced in Entre Ríos and Santa Fe every time forest fires occur.
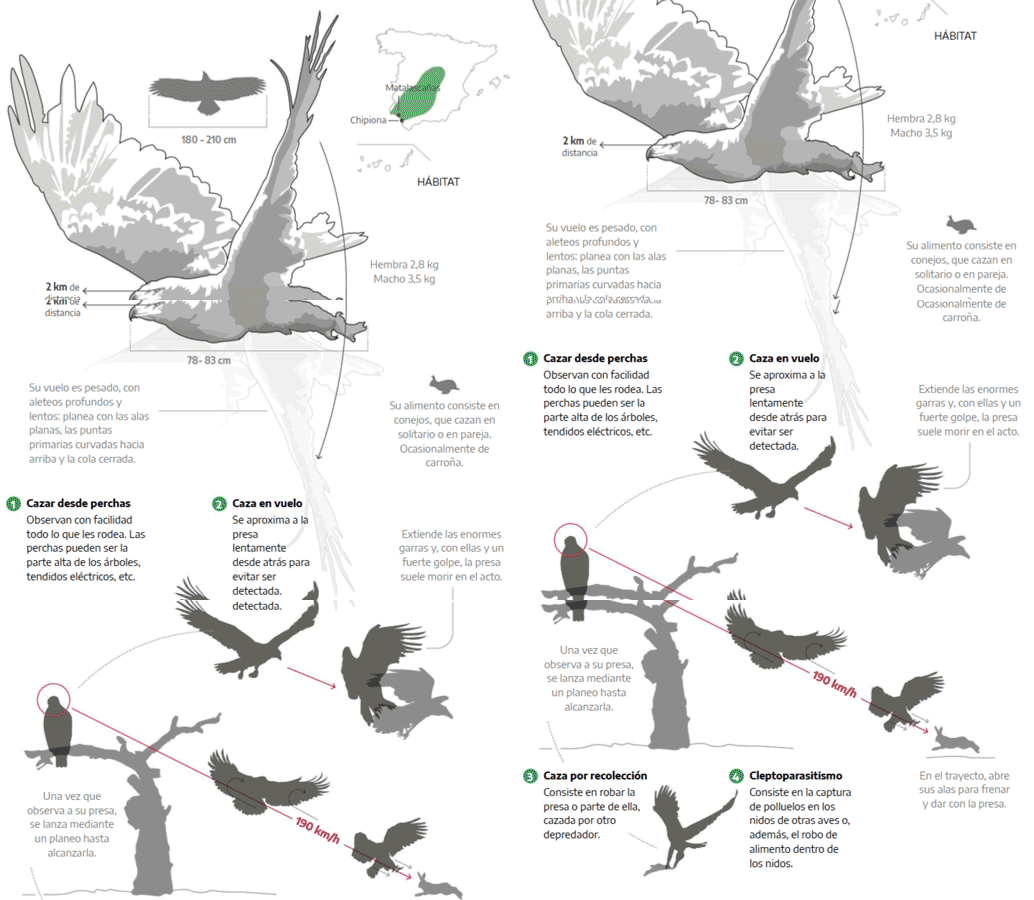
This graph shows characteristics of birds at risk: the decline of waterfowl in the national park makes it necessary to artificially feed birds of prey by releasing rabbits into enclosures.
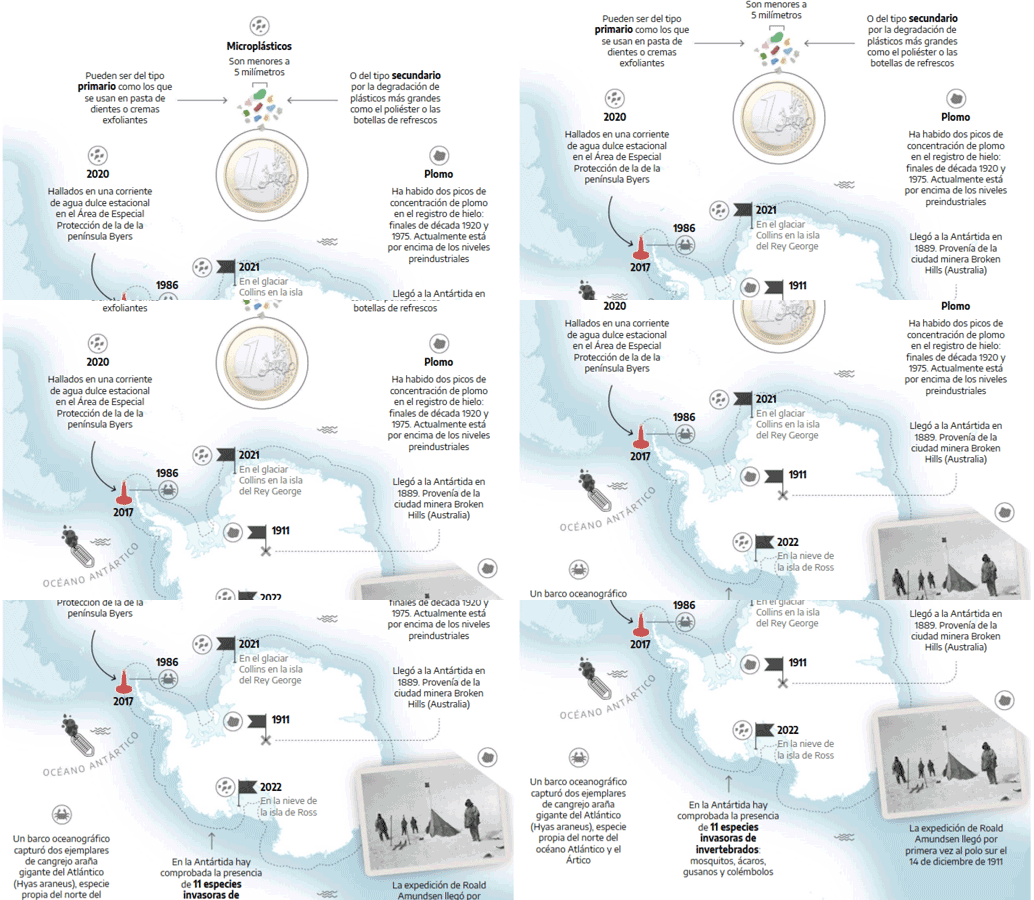
Map reflecting a growing crisis: Scientists detect waste in snow shortly after confirming its presence in freshwater streams and glaciers.